How it works

Data in, insights out

PropertyAI combines public and private datasets, runs them through four machine learning models, and returns about 150 fields for every residential property in five states. Here’s what goes in, what happens to it, and how you can tell how far to trust each number.

Data in, answers out

Three stages behind every field

Data in

  • Cadastre and G-NAFEvery title boundary and address
  • State planning codesZones, overlays and their rules
  • Aerial imageryBuilding footprints and yards
  • Sales and registry dataTransactions, public and licensed
  • ABS CensusPopulation, households, income
  • Proprietary training layersGeospatial, government, geometry

Four models

  • Automated Valuation ModelSale and land value estimates
  • Land Economics ModelHow land is valued, location by location
  • Planning and development analyticsWhat each block can legally carry
  • Micro-Market Price IndexPrice movement at neighbourhood level

What comes out

  • Observed factsZone, overlays, land area, frontage, buildable backyard
  • Development optionsDwelling yield, subdivision, granny flat, extension
  • ValuesProperty and land value, per-parcel value, uplift
  • TimingRedevelopment feasibility
  • MarketGrowth from 2 months to 5 years, turnover

The four models

Built by engineers, urban planners and data scientists

PointData has been building these models since 2013, drawing on decades of work with local and state government on housing, infrastructure and land valuation.

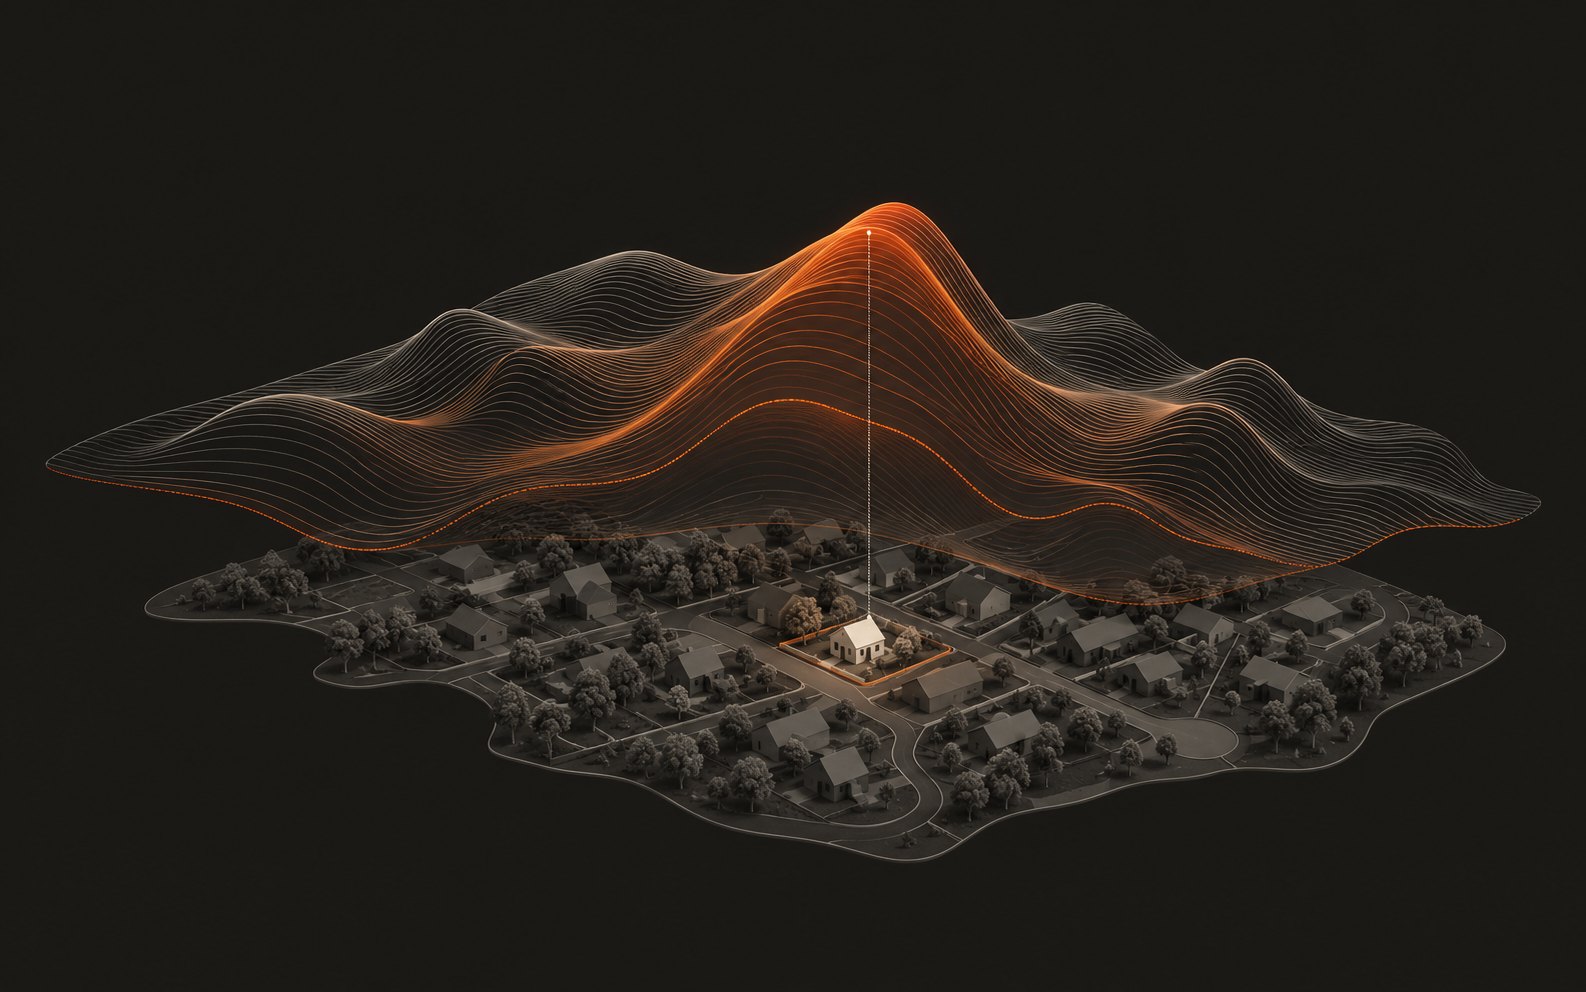
A neighbourhood model with a contour surface of property value rising above it, peaking over one highlighted house

Model 01

Automated Valuation Model

Conventional automated valuations lean on recent sales, which is only half the problem. The AVM adds multi-dimensional machine learning and exclusive training data on how values respond to neighbourhood, planning and market drivers.

  • Targets the stock conventional valuation models handle worst
  • Every estimate has low and high bounds and a confidence score
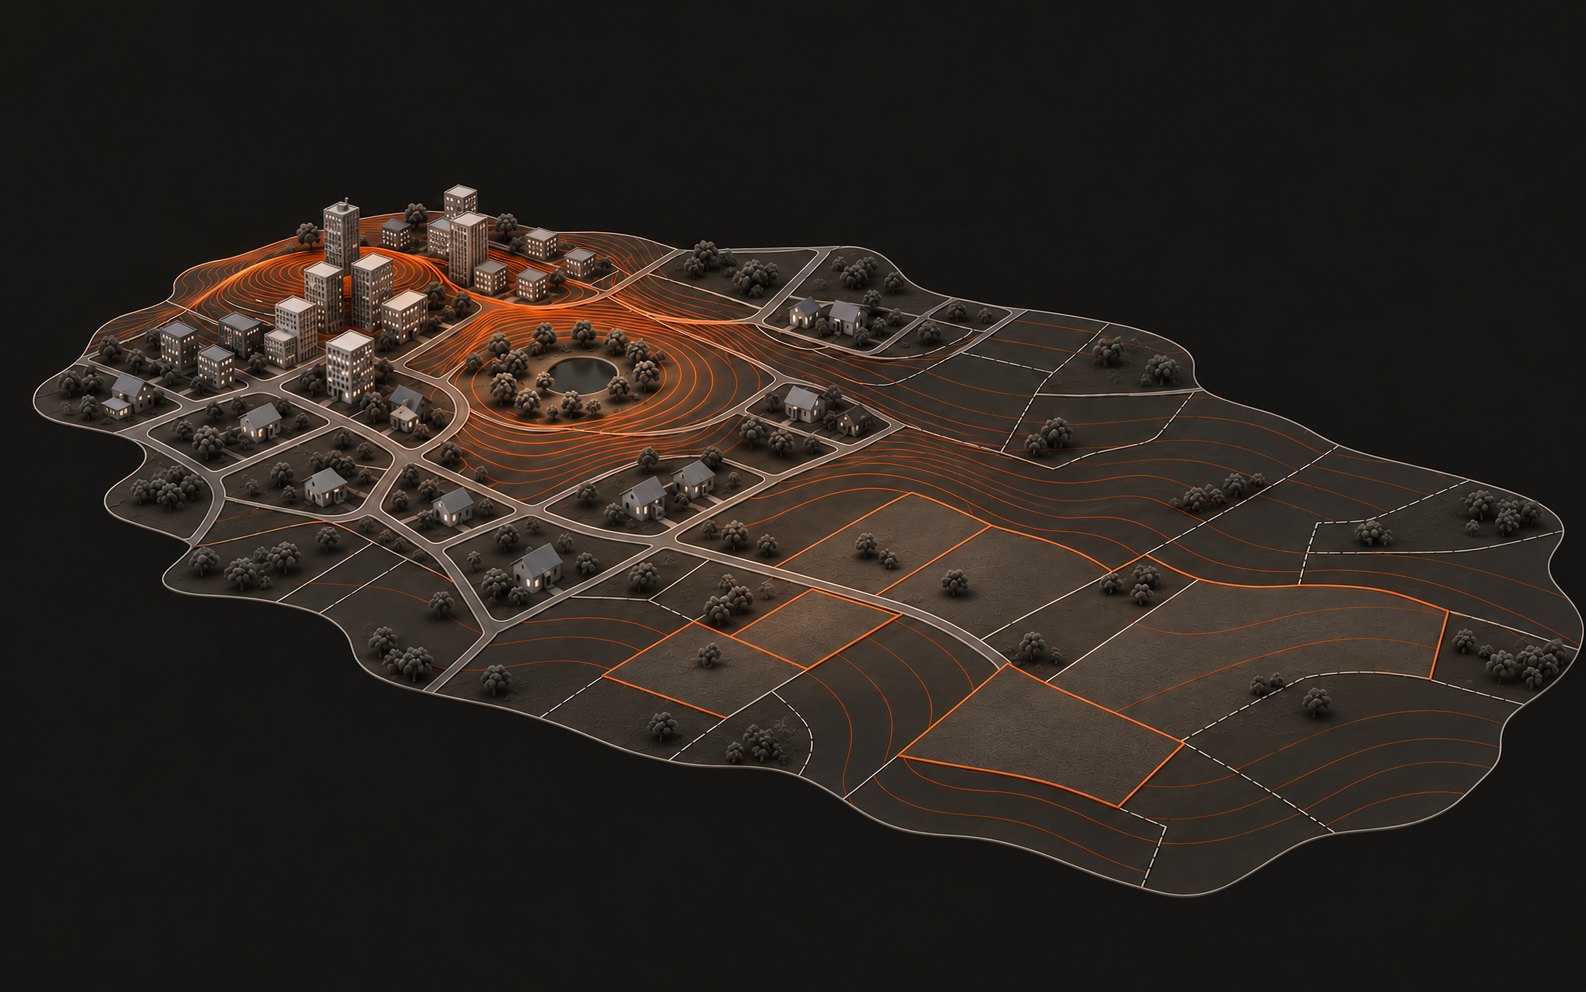
A city model where contour lines of land value ripple out from the centre, a park and transport routes across surrounding parcels

Model 02

Land Economics Model

Research into how land is valued across Australia’s cities, shaped by government work on infrastructure, housing and statutory valuation.

  • Land size, proximity to city features and local amenity
  • Zoning read as an economic input, not a label
  • Used for urban and infrastructure modelling, including transport corridors
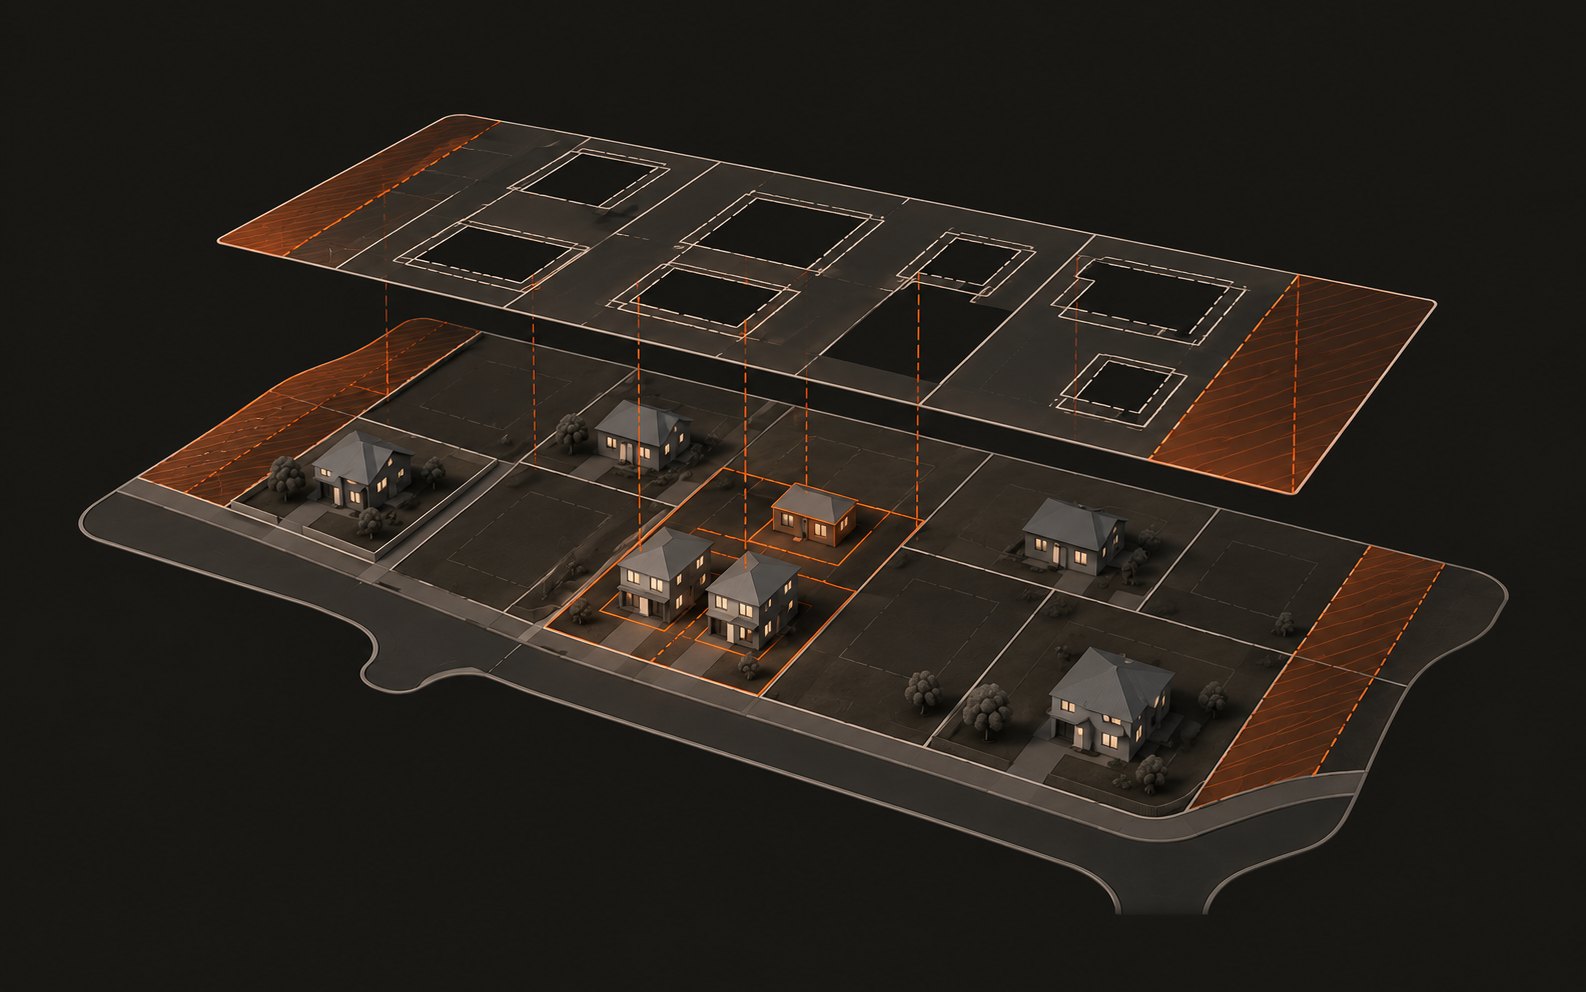
A street of parcels with a planning layer floating above it, setbacks and building envelopes projected down onto one parcel redeveloped as two townhouses and a granny flat

Model 03

Planning and development analytics

Urban and regional planning experience turned into software that runs development scenarios across a council or a whole city.

  • Built by planners, analysts and software engineers together
  • Validated by planners in each state
  • Benchmarked against state land supply methods where possible
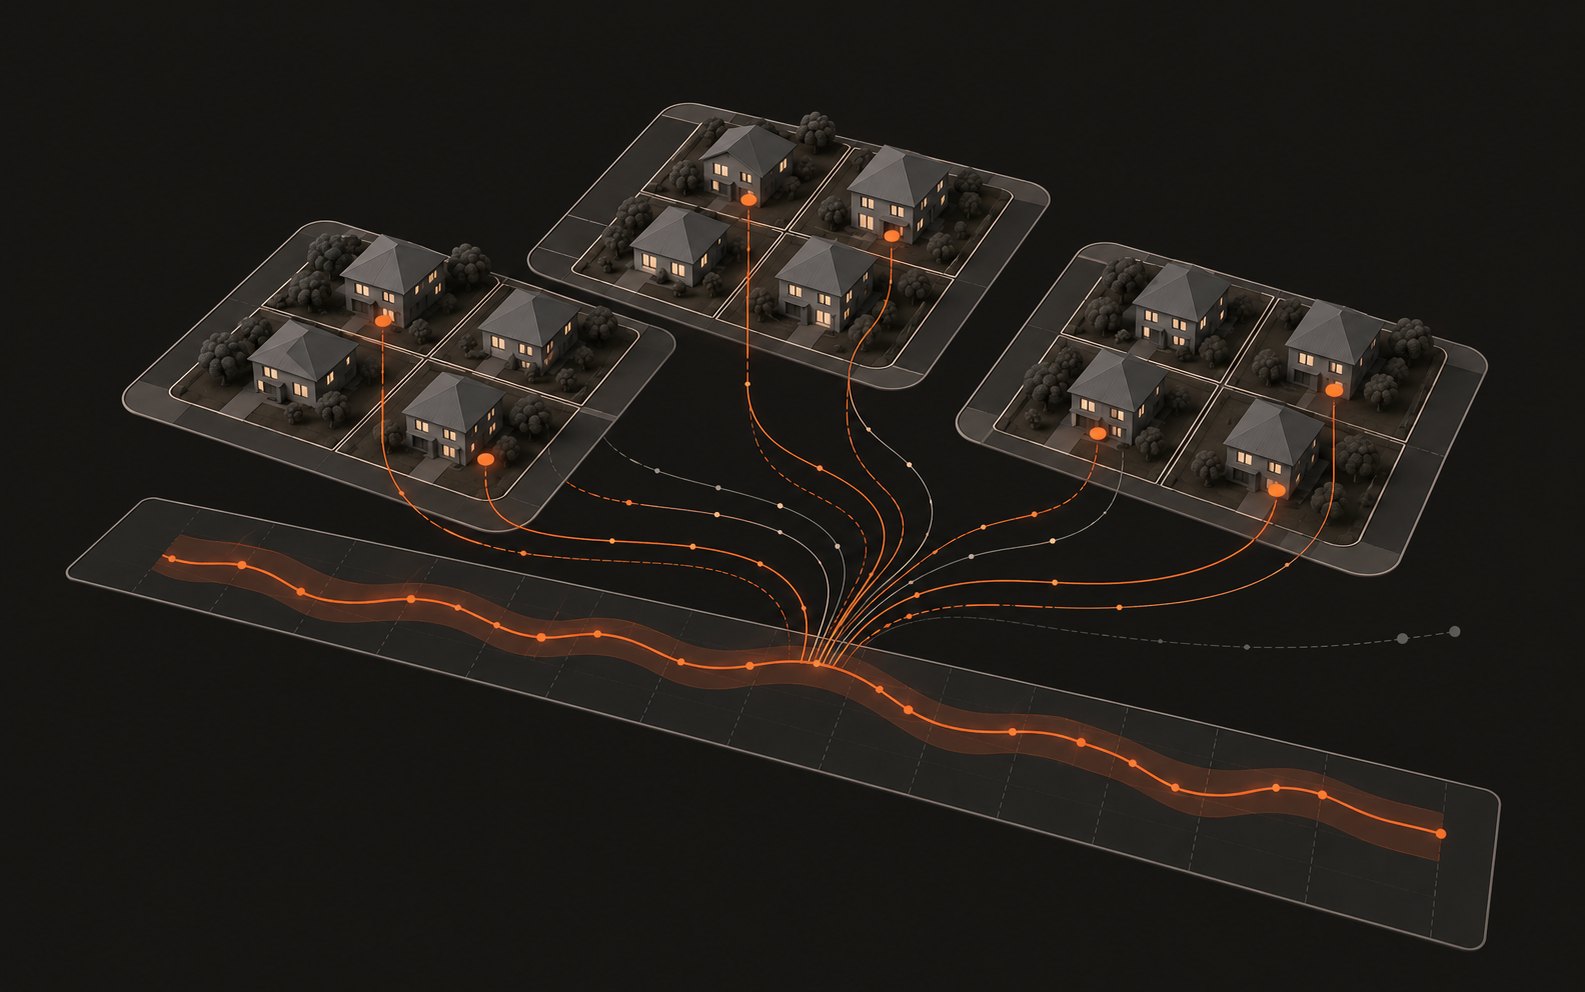
Sales from three like-for-like neighbourhoods flowing into one price index line with a confidence band

Model 04

Micro-Market Price Index

A property-level measure of growth, tracked at neighbourhood level with strict quality control on every time series.

  • Calculated daily, published weekly
  • Draws on up to 2,000 comparable sales from like-for-like neighbourhoods
  • Tested against properties that sold twice

Worked example

Backyards measured on every property.

Whether a granny flat or a second dwelling fits depends on one number most sources guess at. Here’s how it’s produced for every block.

  1. Title area

    The boundary from the cadastre.

  2. Backyard

    The house footprint is traced from aerial imagery and subtracted.

  3. Less setbacks

    The state planning code is applied, boundary by boundary.

  4. Less access

    Space is taken off for a vehicle to reach the rear of the block.

  5. Buildable

    The area left for a new dwelling, and with it whether a granny flat or second dwelling fits.

Most published backyard figures are a percentage applied to land area. This one is a measurement with three named reductions, which is why it can answer yes or no on a second dwelling rather than maybe.

Coverage

Five planning systems, one answer

The property and area models run nationally. What differs by state is the planning geometry, because each state publishes its own.

New South WalesState Environmental Planning Policies, Local Environmental Plans, Development Control Plans, and prohibitive property characteristics.
VictoriaVictorian Planning Provisions, Local Planning Provisions, and prohibitive property characteristics.
QueenslandZone Codes, Neighbourhood Plan Codes, Local Plan Codes, Use and Other Development Codes, and prohibitive property characteristics.
Western AustraliaR-Codes and prohibitive property characteristics.
South AustraliaPlanning and Design Code zones, subzones, Technical and Numeric Variations, and overlays.

See it on your block

Check any address free, or explore them all in Atlas.