Market Pulse
Bucking the downturn: where house values are still rising
Every capital city is falling right now. But “the market” is not one market: 155 areas are still rising on both the 3- and 6-month view.

Every Australian capital city is falling right now. But “the market” is not one market.
In our latest PropertyAI Market Pulse, we looked at house values across 958 micro-areas in Sydney, Melbourne, Brisbane, Perth and Adelaide, on both 3-month and 6-month annualised trends.
The city-wide picture
All five capitals are down on both horizons. Sydney and Perth are falling fastest; Brisbane and Adelaide the slowest.
| City | 3-month | 6-month | 12-month | Areas rising on both |
|---|---|---|---|---|
| Sydney | −7.7% | −8.9% | −7.4% | 33 of 254 |
| Melbourne | −6.0% | −7.1% | −6.6% | 44 of 302 |
| Brisbane | −5.5% | −6.8% | −0.1% | 38 of 178 |
| Perth | −7.8% | −8.5% | −0.8% | 22 of 132 |
| Adelaide | −5.8% | −6.3% | −1.9% | 18 of 92 |
155 areas still rising on both
Beneath that, 155 areas are still rising on both horizons:
- Melbourne: 44 areas. Laverton is up about 36% and 37% annualised, and 14% over the year.
- Brisbane: 38 areas. Annerley is at +30% and +38% annualised, +31% over twelve months.
- Sydney: 33 areas, led by Cecil Hills in the west.
- Perth: 22 areas, mostly inner east and north-east.
- Adelaide: 18 areas, led by the southern hills. Blackwood is at +14% and +39%.
Areas with 3-month and 6-month growth both above zero.
Source: PropertyAI Market Pulse. House values by SA2 area, November 2026.
Each dot is a suburb group, coloured by the average of its 3- and 6-month trend. Ringed and numbered: the 10 strongest rising areas.
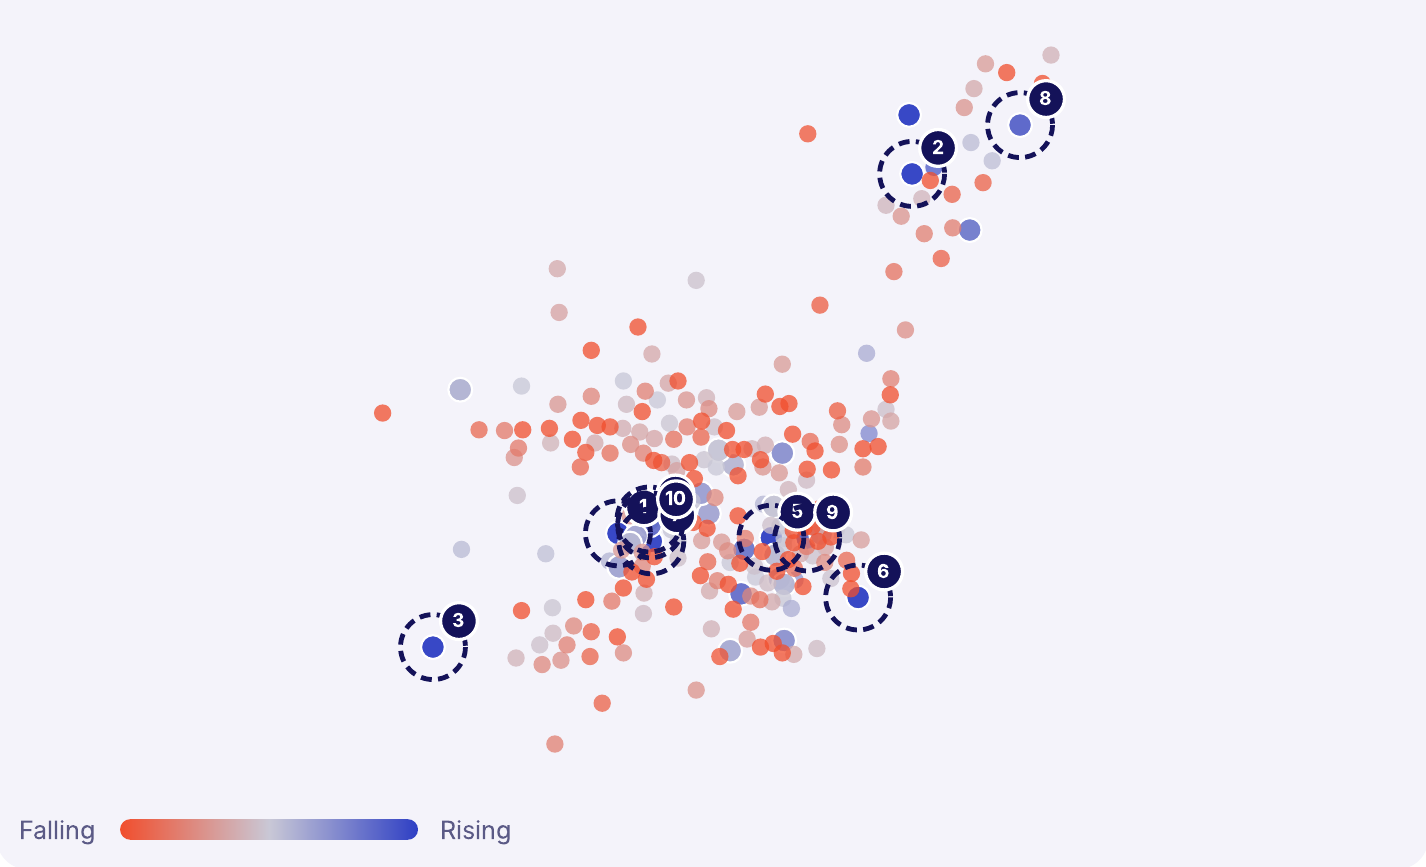
Source: PropertyAI Market Pulse report, November 2026.
Annualised 3- and 6-month change; actual 12-month change.
| # | Area | 3-month | 6-month | 12-month | Signal |
|---|---|---|---|---|---|
| 1 | LavertonMelbourne | +36.3% | +37.1% | +14.1% | Sustained |
| 2 | AnnerleyBrisbane | +30.2% | +37.9% | +31.3% | Sustained |
| 3 | Cecil HillsSydney | +36.7% | +33.6% | −2.3% | Sustained |
| 4 | Manning – WaterfordPerth | +26.6% | +21.7% | +7.2% | Sustained |
| 5 | BlackwoodAdelaide | +13.8% | +39.3% | +13.7% | Cooling |
Source: PropertyAI Market Pulse. House values by SA2 area, November 2026.
Averages hide the story
The lesson for investors, lenders and developers: averages hide the story. The pockets that are holding are specific, mappable and often not where you would guess.
Using both the 3- and 6-month view matters too. It separates sustained strength from a one-quarter blip, and flags areas that are just turning.
General information only, not financial advice. This article does not take into account your objectives, financial situation or needs, and is not a recommendation to buy, sell or hold any property. Values, growth rates and rankings are statistical estimates that can be revised, and past performance is not a reliable indicator of future performance. Get independent professional advice before making any decision. See our terms and conditions.
More from News

PropertyAI Atlas
See every micro-market behind the numbers
Market Pulse maps, sales and redevelopment insight for any address, in Atlas.