Market Pulse · Inner, middle, outer
The outer ring is holding up best in 4 of 5 capitals
We split each capital into inner, middle and outer rings. Sydney’s inner ring is the weakest of all fifteen, at −14.2% a year.
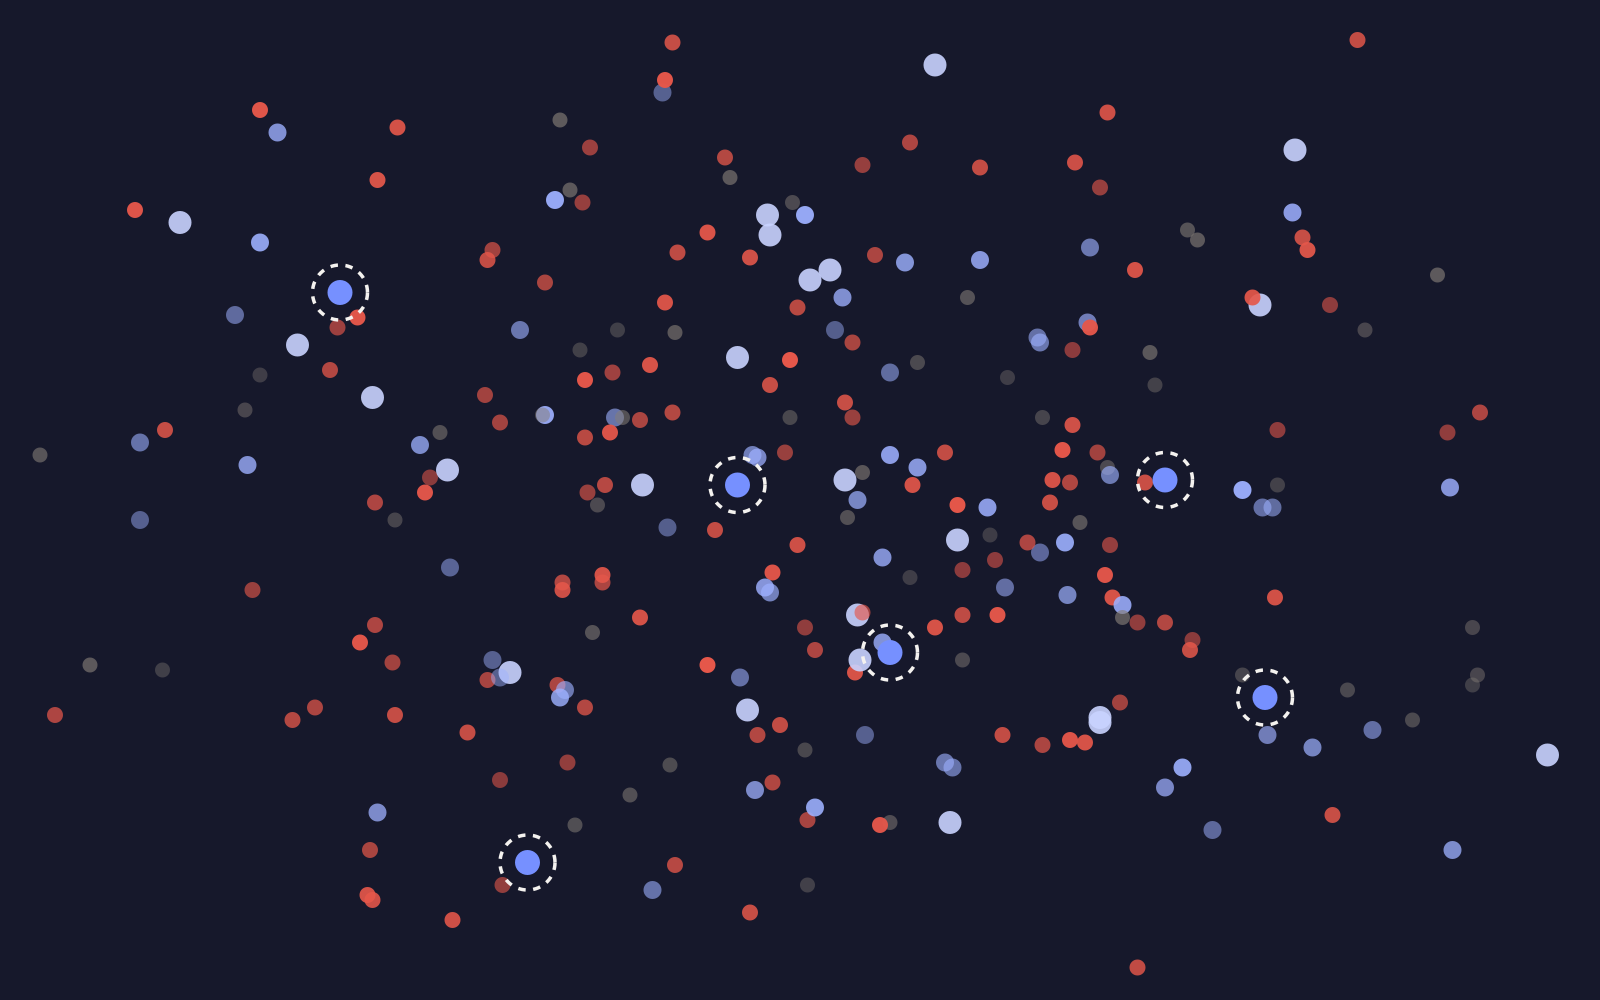
How do house price trends change with distance from the city centre? We grouped local areas in each capital by distance from the CBD: inner (within 10 km), middle (10 to 25 km) and outer (beyond 25 km).
The outer ring is firmest in 4 of 5 capitals
The outer ring is falling slowest in Sydney, Melbourne, Perth and Adelaide. The inner ring is the firmest in Brisbane.
Sydney’s inner ring is the weakest of the fifteen rings, at −14.2% a year.
3-month annualised growth, median across the neighbourhoods in each ring. Inner: under 10 km from the CBD. Middle: 10 to 25 km. Outer: beyond 25 km.
| City | Inner | Middle | Outer | Firmest ring |
|---|---|---|---|---|
| Sydney | −14.2% | −10.1% | −9.4% | Outer |
| Melbourne | −7.7% | −6.5% | −3.6% | Outer |
| Brisbane | −4.4% | −10.6% | −8.2% | Inner |
| Perth | −9.8% | −11.1% | −7.5% | Outer |
| Adelaide | −10.0% | −7.0% | −5.1% | Outer |
Source: PropertyAI Market Pulse, PointData Micro-market Price Index. House values, capital city neighbourhoods, November 2026.
Each capital as three rings
Few neighbourhoods are rising on both the 3-month and 6-month view in any ring. The outer rings have the highest shares in Sydney and Melbourne, and Brisbane’s and Perth’s inner rings stand out at 14% and 13%. Median house values fall with distance in every city, from $2.50m in inner Sydney to $798k in outer Melbourne.
Rising: share of neighbourhoods with 3-month and 6-month growth both above zero.
| City | Rising, inner | Rising, middle | Rising, outer | Median, inner | Median, middle | Median, outer |
|---|---|---|---|---|---|---|
| Sydney | 0.8% | 1.8% | 6.2% | $2.50m | $1.81m | $1.14m |
| Melbourne | 4.7% | 6.4% | 10% | $1.36m | $1.05m | $798k |
| Brisbane | 14% | 3.2% | 10% | $1.60m | $1.15m | $910k |
| Perth | 13% | 3.4% | 6.4% | $1.59m | $1.06m | $863k |
| Adelaide | 3.0% | 8.4% | 5.4% | $1.28m | $904k | $805k |
Source: PropertyAI Market Pulse, PointData Micro-market Price Index. House values, capital city neighbourhoods, November 2026.
Firmest area in each ring
Even in falling rings, some local areas are rising. Perth has the strongest of them: Mundaring, 30 km out, is up 10.6% annualised over three months, and Cottesloe 8.6%. In Brisbane, Lockyer Valley – East has every one of its neighbourhoods rising on both measures.
One local area per ring, per city. 3- and 6-month growth annualised; rising is the share of its neighbourhoods rising on both.
| Local area | City | Ring | From CBD | 3-month | 6-month | Rising | Median house |
|---|---|---|---|---|---|---|---|
| Rosebery – Beaconsfield | Sydney | Inner | 5 km | −0.3% | −3.3% | 36% | $2.14m |
| Penshurst | Sydney | Middle | 15 km | −0.3% | −0.3% | 19% | $1.80m |
| Lake Munmorah – Mannering Park | Sydney | Outer | 83 km | +4.4% | +1.4% | 95% | $874k |
| Elwood | Melbourne | Inner | 8 km | 0.0% | +0.5% | 42% | $1.60m |
| Derrimut | Melbourne | Middle | 17 km | +2.7% | +4.7% | 93% | $825k |
| Koo Wee Rup | Melbourne | Outer | 68 km | +5.3% | +3.8% | 92% | $665k |
| St Lucia | Brisbane | Inner | 4 km | +5.1% | +0.9% | 57% | $1.70m |
| Karalee – Barellan Point | Brisbane | Middle | 22 km | +3.6% | −4.2% | 17% | $1.21m |
| Lockyer Valley – East | Brisbane | Outer | 67 km | +7.2% | +5.0% | 100% | $856k |
| Claremont (WA) | Perth | Inner | 8 km | +7.4% | +5.8% | 95% | $2.98m |
| Cottesloe | Perth | Middle | 11 km | +8.6% | +3.3% | 94% | $4.64m |
| Mundaring | Perth | Outer | 30 km | +10.6% | +2.6% | 92% | $1.19m |
| Richmond (SA) | Adelaide | Inner | 3 km | −0.9% | −3.0% | 19% | $1.18m |
| Coromandel Valley | Adelaide | Middle | 13 km | +8.2% | +6.3% | 90% | $1.22m |
| Nairne | Adelaide | Outer | 31 km | −0.3% | −1.0% | 15% | $859k |
Source: PropertyAI Market Pulse, PointData Micro-market Price Index. House values, capital city neighbourhoods, November 2026.
How we measured it
Each local area is placed by the straight-line distance from its centre to the city’s GPO. Fixed distances are used in every city, so Adelaide’s outer ring is smaller than Sydney’s. Growth is the 3-month change, compounded to a yearly rate: it reacts quickly, so it is volatile. Read small areas for direction, not size.
These figures come from the free PropertyAI Market Pulse feed, with index values dated 12 November 2026. They are built differently from earlier Market Pulse releases, which used an Atlas extract weighted by property counts, and will not match them.
General information only, not financial advice. This article does not take into account your objectives, financial situation or needs, and is not a recommendation to buy, sell or hold any property. Values, growth rates and rankings are statistical estimates that can be revised, and past performance is not a reliable indicator of future performance. Get independent professional advice before making any decision. See our terms and conditions.
More from News
PropertyAI Atlas
See every micro-market behind the numbers
Market Pulse maps, sales and redevelopment insight for any address, in Atlas.